Nodes are the essential building blocks in the Advanced interface to the Poser Material Room. They are the graphical representation of mathematical function calls, that is: calculation procedures which turn parameters (inputs) to a result (output).
Advanced
The nodes from the Variables group tell me about the position, in space and time, of the spot that the PoserSurface definition is constructed for. There are two kinds of results from these nodes:
- Single values.
- Three value ‘vectors’. Like a color is defined by (Red, Green, Blue), so is a point in space defined by (X,Y,Z) and so on. These are discussed in this article, in the next article (stretching dPdu, dPdv) and the article after that (curvature dNdu, dNdv)
 Slightly more intriguing than just single values U and V are normal N and point P:
- P is a vector representing the position of that spot itself in space, and
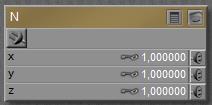
- N is a vector, representing the surface normal at the spot at hand.
So P= (0,1,0) for the spot on the object surface one unit above the scene center, and N= (0,1,0) for pointing upward from that spot.
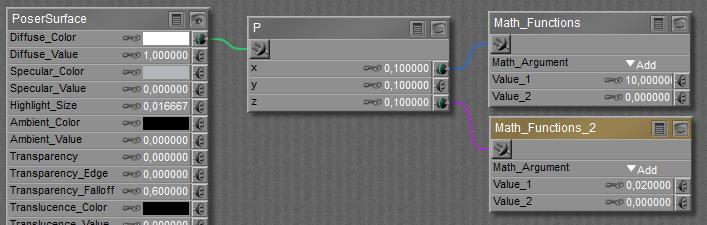
Actually, the first component of the vector is the first component of place P or normal N respectively, multiplied by the value presented in the node, and multiplied by the inputted value (or image brightness) plugged into that slot as well:
Result X (xyz) = N X (xyz)* NodeValue X * ImageBrightness (xyz)
Visualization
To visualize these for a probably better understanding, the respective node is plugged into Diffuse Color. The (X,Y,Z) vector will then be interpreted as (Red, Green, Blue) as far as the values are in the 0..1 range. Values outside that range will be clipped, like negatives are interpreted as 0.
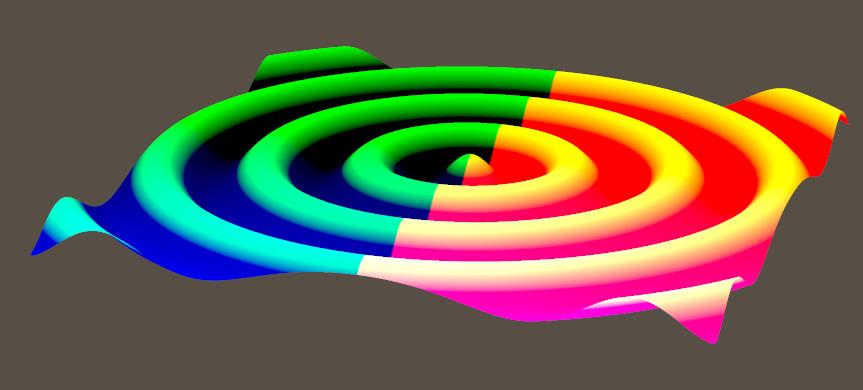
The P node, translated to colors, gives:
In the right half of the object, X is positive so Red is “in” but in the left half, Red is missing. In the upper half of the object, Y is positive so Green is “in” but in the lower half, Green is missing. In the front half of the object, Z is positive so Blue is “in” but in the back half, Blue is missing.
So the right upper back part will show full Red and Green but no Blue, that is: full Yellow. And so on. The colors are hard, as the vector component exceed 1.0 quickly.
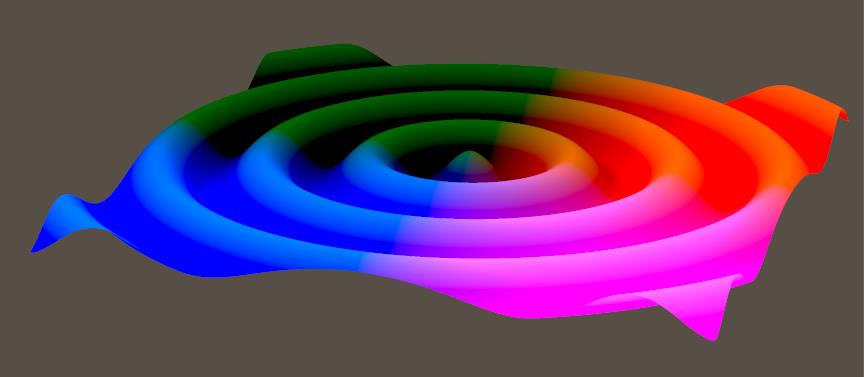
To visualize things even more, this is what I get when the P vector is shrunk: softer colors because of smaller RGB values, because the values in the node were set to 0.01 (instead of 1.0):
And when the first component is made large and the third one small:
Then I’ll get hard color edges in X (left right) direction, and soft gradients in Z (back front) direction:
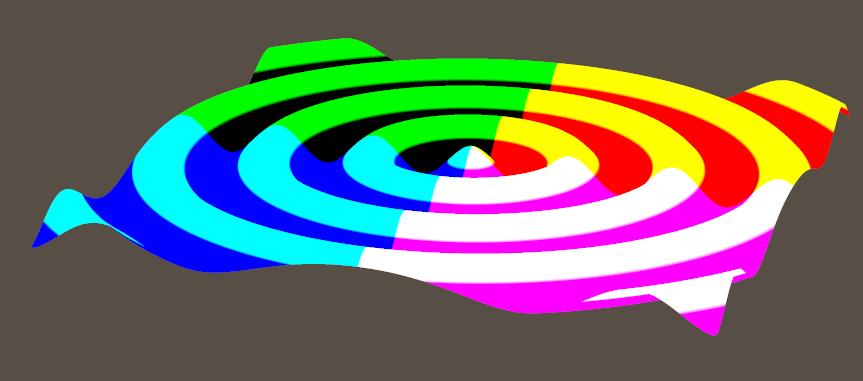
The N node can be visualized as:
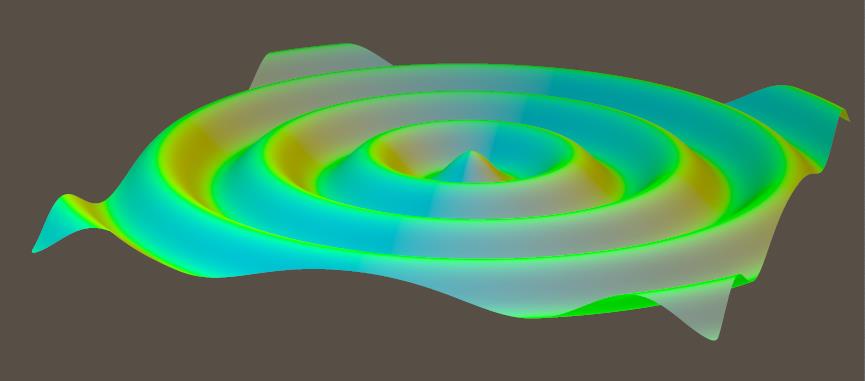
Normals point – perpendicularly – away from the surface. Pointing towards the upper (pos Y) left (neg X) front (pos Z) disables the Red (negative X is clipped to 0) and hence leaves Green and Blue making Cyan. And so on.